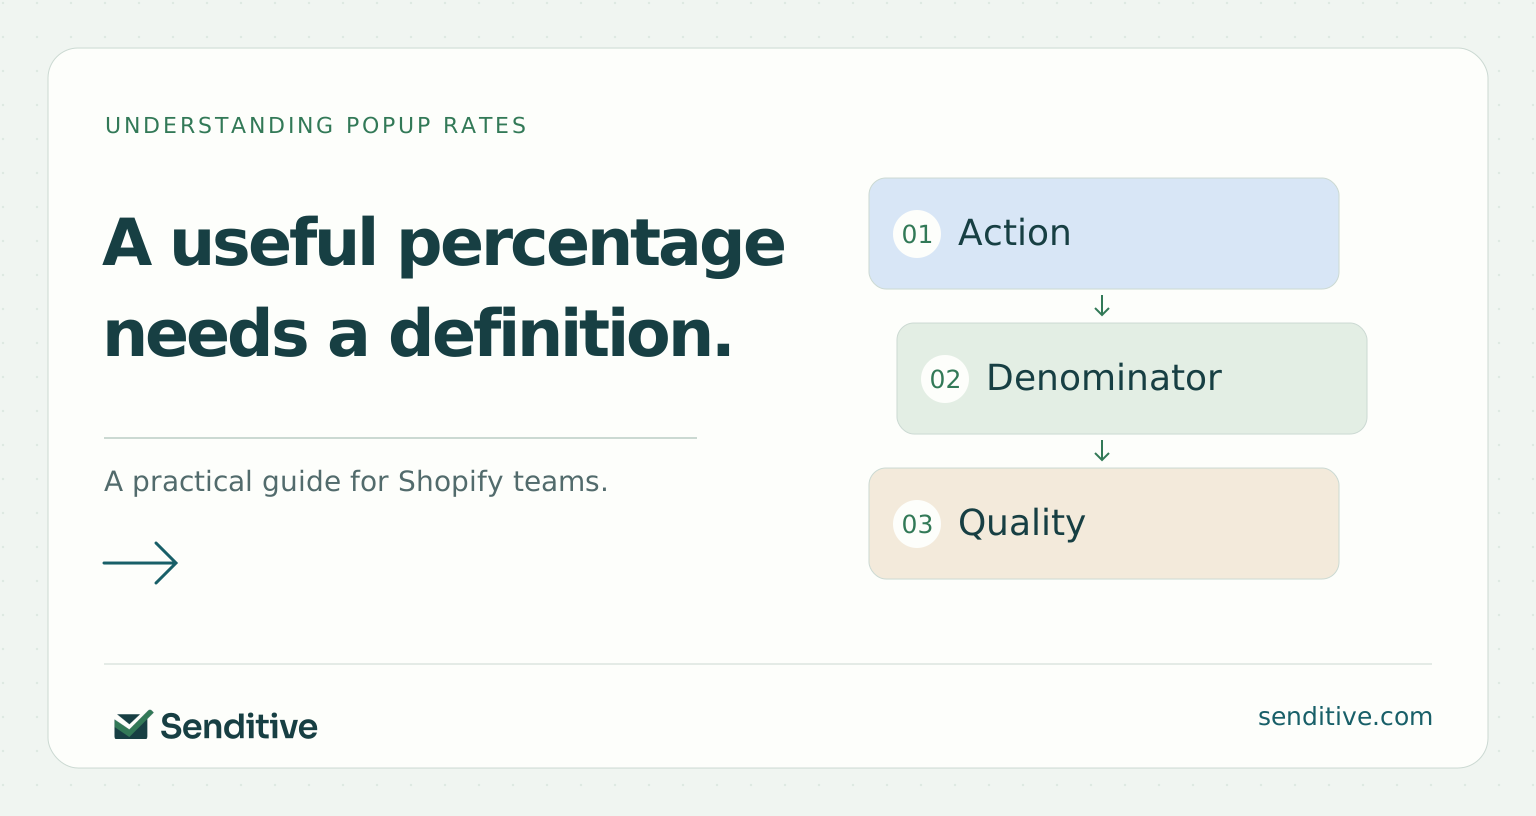
A popup rate looks simple until two reports show different percentages for the same form. One may divide total submissions by total views; another may use unique visitors, eligible visitors, or a different conversion action. A confident benchmark becomes unhelpful when its denominator does not match yours.
A good rate is useful only in context. You want a form that reaches appropriate visitors, clearly invites a subscription, and produces an audience your store can serve. This guide explains how to evaluate the number without inventing a universal target or letting a strong-looking percentage hide poor subscriber quality.
Start with the exact question the rate answers
Write the formula in words before reporting a percentage. A form event rate might divide submitted form events by viewed form events. A visitor rate might divide unique submitters by unique viewers. A site capture rate might divide new eligible subscribers by visitors who could have seen the invitation. Those are related questions with different denominators.
In Klaviyo's form Overview, submit rate uses total submitted events divided by total viewed events. Repeat views and repeat actions can therefore affect the calculation. The number describes the platform's event definition, rather than a universal percentage of all people visiting your store.
Name the rate in a way another person can reproduce. Record the form, dates, device scope, numerator, denominator, and relevant filters. If you cannot explain why the same visitor might count more than once, do not compare the figure directly with a unique-person benchmark. Clear definitions turn an apparent disagreement into a question you can investigate.
Reference: Sign-up form analytics.
Keep total, unique, and eligible denominators separate
A person may see a form several times before submitting it. Counting those views as separate events can produce a different rate from counting the person once. Neither calculation is automatically wrong, but each needs a label. Do not switch between them when a result becomes more favorable.
Klaviyo's current A/B results use unique metrics, which differ from the total-event rate on Overview. For display-time tests, the documentation describes eligible unique views and an eligible submit rate. That adjustment matters because visitors who leave before a delayed form appears should not simply disappear from a fair timing comparison.
Use the definition calculator to see how the denominator changes the percentage. Enter compatible counts and keep the result attached to its definition. If a report uses eligibility rather than actual exposure, explain that choice. A form shown to fewer people may have a higher view-based rate while collecting fewer subscribers from the same underlying traffic opportunity.
Reference: A/B testing sign-up forms.
Put it into practice
Popup rate definition calculator
Compare total, unique-viewer, and eligible rates
Enter matching definitions from the same form and period. Total events can repeat; unique counts represent people or the platform’s documented unique unit.
 senditive.com
Verify what the platform counts as a submission
A submit is not always the same thing as an email subscription. Klaviyo documents that a form without an email or phone field can count a Go to URL action, and a multi-step form can register a submit at the first collected channel. Read the form's actual structure before interpreting the headline number.
Track email collection, SMS collection, completion, and confirmation where each is relevant. A visitor may complete one step but decline another channel. With list-based double opt-in, the person must confirm before being added to the list. Do not describe every first-step interaction as a fully confirmed, two-channel subscriber.
Reference: Sign-up form analytics; Double opt-in.
Measure exposure as well as response
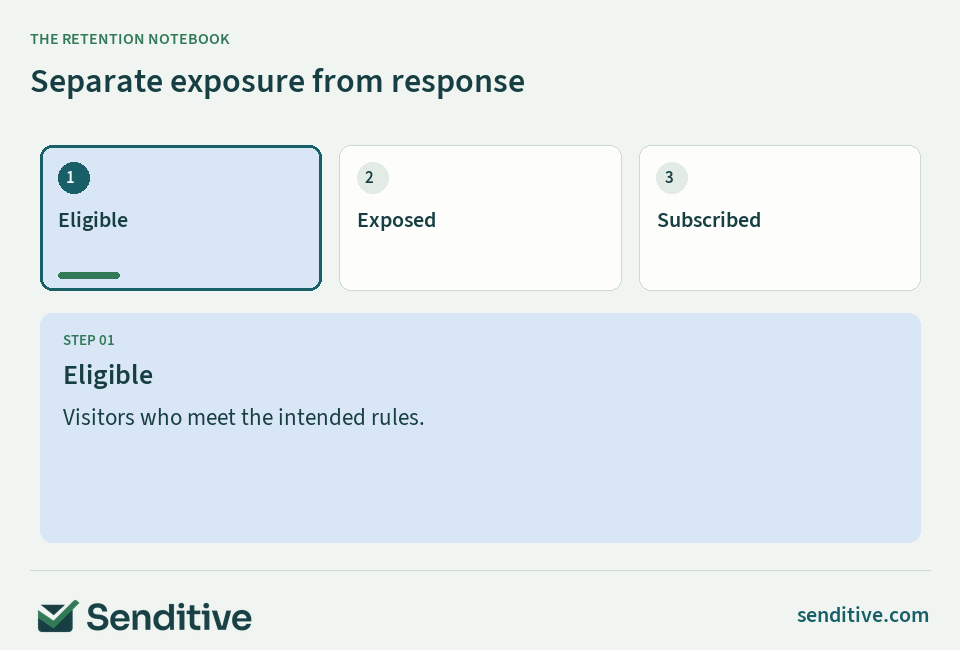
A popup may perform well among viewers while reaching only a small part of the intended audience. Record how many people were eligible, how many saw the invitation, and how many took the desired action when those measures are available. This separates a visibility question from a response question.
Check targeting, returning-subscriber exclusions, device rules, page restrictions, and timing. Some exclusions protect the experience and should not be removed merely to increase form views. A visitor who has already subscribed does not need to be counted as a missed opportunity for the same invitation.
Use your form platform's own analytics and event definitions. Shopify Forms provides submission analytics and stored form data, but its fields and counting should not be assumed identical to another tool. If exposure is uncertain, first verify the intended display behavior with representative sessions. Comparing response rates cannot solve a form that is absent from the pages or devices you intended to reach.
Reference: Managing Forms.
Use peer benchmarks as context rather than a verdict
A peer benchmark can help you ask a better question: is this form unusually different from other forms counted in a similar way? It cannot explain the reason by itself. The comparison may differ in offer, traffic quality, format, country, product category, or the visitor's familiarity with the brand.
Klaviyo's form analytics can show peer benchmark context for popup submit rates. Read the relevant report definition and available comparison group rather than copying a percentage from a screenshot or an agency article. A benchmark label is a starting point for investigation, not evidence that a specific redesign will improve orders.
Compare your own stable periods and meaningful segments alongside the external context. Keep the baseline when you change the form. If your audience or acquisition mix changed, record that too. A target should motivate an appropriate experiment, while preserving the customer experience and subscriber quality you actually need. Avoid declaring a rate good or bad without those conditions.
Use a free consultation to discuss the definitions and guardrails that make sense for your own signup program.
Create a compact scorecard with the rate definition, eligible audience, exposure, intended channel subscriptions, required confirmations, and mature first-order outcomes. Mark unavailable measures as unavailable rather than entering zero. Add the current traffic mix and offer version so the next review can explain a change. If the headline percentage improves while confirmation quality falls, keep both observations visible. Decide which customer or operational question that pattern raises before announcing a winner. This makes the scorecard a record of the journey rather than a decorative target with no clear denominator.
Reference: Sign-up form analytics.
Put it into practice
Benchmark context check
See which comparison conditions need reconciling
Change the inputs to prepare your next decision. This tool runs locally and does not connect to your store.
senditive.comBreak down the audience before blaming the form
Overall averages can hide very different visitor groups. Compare mobile and desktop, new and returning visitors where identifiable, and the acquisition sources that materially change intent. A high-intent product search visitor and a broad social campaign visitor may respond differently to the same invitation.
Keep the groups large enough to interpret and avoid an endless series of tiny slices. Start with a business reason for the comparison, such as a mobile usability concern or an acquisition campaign with a different promise. Do not search every possible segment simply to find a favorable percentage.
Watch for mix changes. If more traffic arrives from a lower-intent source, the combined rate can fall even when each source behaves as before. The right response may be a better acquisition promise or a different invitation, rather than a global popup redesign. Write down the context that changed so the next review can distinguish audience movement from form performance.
Follow subscriber quality beyond the submit
Define quality in terms your program can observe responsibly. Useful measures include eligible channel subscription, confirmation where required, valid reach, early unsubscribes or complaints, relevant product engagement, and first-order behavior over a suitable period. Do not reduce a person's value to whether they ordered immediately.
Follow comparable signup cohorts and keep prior customers separate when evaluating first orders. A form offering product guidance may attract a different purchase timeline from a first-order discount. Compare the resulting audience and commercial purpose, rather than rewarding whichever form produces the most low-commitment interactions.
Reference: Revenue metrics for sign-up forms; Collecting contact information.
Put it into practice
Subscriber quality cohort calculator
Follow the audience beyond the initial submit
Use one cohort, a stated entry snapshot, and equal follow-up. These observed quality measures do not establish a universal benchmark.
senditive.comAllow enough comparable evidence to learn
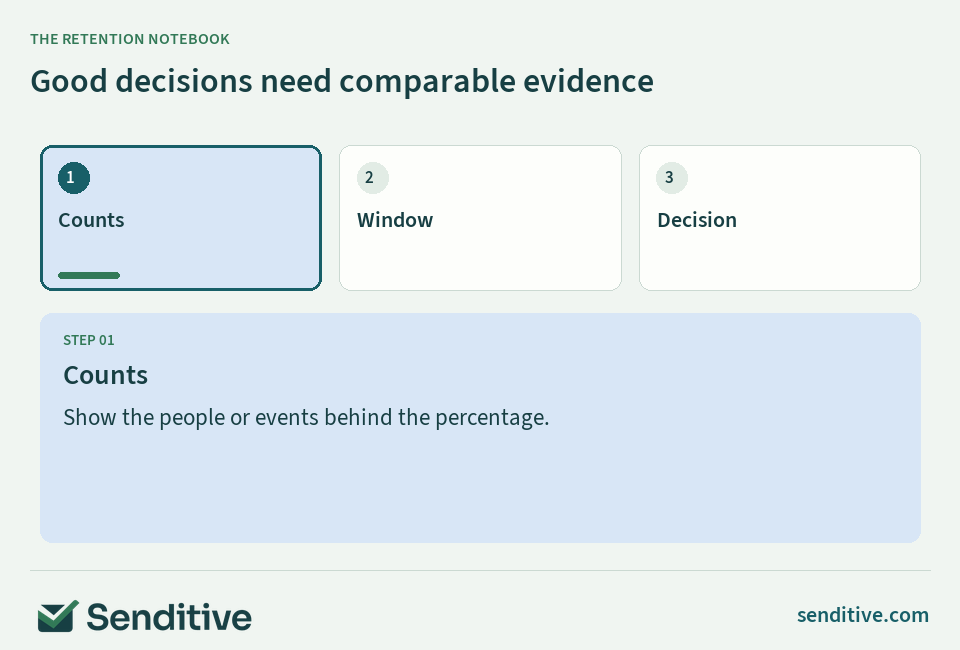
A few extra submissions can move a small sample's rate noticeably. Show counts beside percentages, and compare periods with similar audience conditions and sufficient follow-up. A precise decimal does not mean the estimate is stable. If the sample is small, describe the result as an early observation.
When testing a change, define the primary question and review plan before starting. Keep track of the platform's allocation settings and whether traffic shifts toward a selected winner. That process may be useful operationally, but it affects how you interpret a simple comparison of final totals.
Do not stop a test solely because one variation leads on a convenient day. Use an appropriate testing method for decisions that need statistical confidence, and make clear when a simple calculator does not provide it. The tools in this guide explain definitions and observed quality; they do not replace an experiment's sample planning, uncertainty analysis, or commercial judgment.
Reference: A/B testing sign-up forms.
Diagnose the pattern rather than chasing the percentage
Read several measures together. Low exposure with reasonable response suggests checking reach and targeting. Strong exposure with weak response suggests investigating relevance, clarity, timing, or friction. Strong submit rate with weak eligible subscriber growth suggests checking the conversion action and subscription handoff.
A strong rate with poor downstream quality raises a different question: what did the invitation attract, and was the promise fulfilled? Review the acquisition source, incentive, welcome experience, and product fit before collecting even more of the same audience. A larger top-of-funnel count can amplify an unresolved mismatch.
Choose the next action from the pattern and its evidence. Repair a broken process first; test a focused improvement after the path works. Keep what you did, why you did it, and how the result will be evaluated. A healthy reporting habit makes it harder for a tempting headline number to replace the actual purpose of the signup program.
Set a target with quality and experience guardrails
Use a target statement with three parts: the precisely defined rate, the comparable audience and period, and the conditions you want to protect. Those conditions might include confirmation quality, first-order contribution, complaint levels, or the ability to browse comfortably on a phone.
Review the target when the traffic source, offer, form format, or purchase cycle changes. Preserve the old definition so a new report does not look like an improvement simply because it counts something else. If a higher rate produces a less useful audience, record the tradeoff explicitly rather than calling the test a win.
A free consultation with Senditive can help you discuss the next priority for your signup forms and follow-up program. The useful goal is a reliable invitation that earns appropriate subscriptions and supports the customer journey. A good popup rate contributes to that goal; it does not define the entire outcome by itself.
Your questions, answered
Is there one good popup signup percentage for every Shopify store?
No single percentage applies across definitions, devices, offers, traffic, formats, and product decisions. Start with a reproducible formula and comparable context. Use peer benchmarks to investigate differences, then assess subscriber quality and business outcomes.
Why does Klaviyo Overview differ from the A/B test rate?
Overview uses total form events, while current A/B results use unique metrics. Display-time tests can use eligible unique views. Check the specific report and test before comparing percentages.
Does completing the email step mean someone subscribed to SMS?
No. Treat each channel and its relevant confirmation process separately. A multi-step form can record an early submit before later steps are complete, so inspect the actual channel status and event definitions.
Can a lower signup rate still be the better outcome?
Yes, depending on exposure and audience quality. A form can collect fewer but more appropriate subscribers, or preserve a better browsing experience. Compare eligible growth and mature commercial outcomes with the same definitions before choosing.
Choose your next improvement
Judge a popup rate by the question it answers and the audience it creates. Clear definitions, comparable context, and subscriber-quality evidence make the number useful.